Visualize Go app benchmarking

It is interesting to analyze how a data structure has a different performance based on number of items or the way of implementation. Benchmark metrics simplify the review of performance insights. We can use Spreadsheets or Excel to visualize those metrics and guess the complexity level. I figured out how to automate the process using simple but effective approach.
I was looking for a universal solution to show charts and make empirical analysis for some algorithms. Ideal tool should run an application with dynamic arguments and then build the actual chart. Here is the example of a basic version:
$ bench -step i*10 -max 100000 -- app <N>
In the end, I should see a Google Chart with Time/N data. I could not able to find any tool to generate such charts, though. However, I got some custom integrations with benchmark libs in Ruby and Golang, which can build charts based on Benchmarks results.
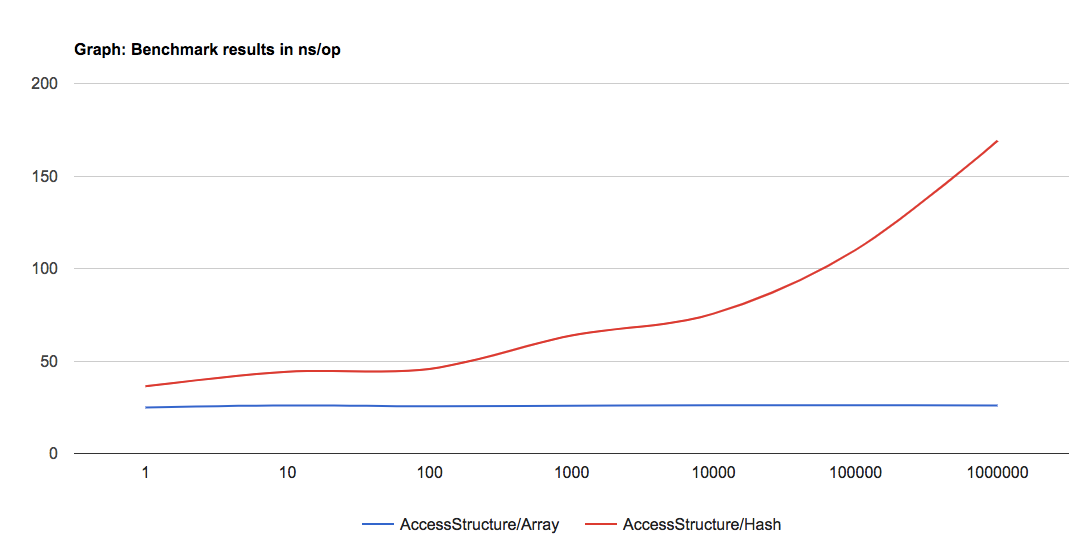
I want to draw your attention to one small tool available here: https://github.com/codingberg/benchgraph. The client part parse standard Go benchmark results and sends the data to a server. It uses the convention in benchmark names to build function result performance. Here is the example of benchmark code and output:
package benchmarks

import (
	"fmt"
	"math/rand"
	"testing"
)

/*
BenchmarkAccessStructure show compare metrics between data strucuture and number of items.
*/
func BenchmarkAccessStructure(b *testing.B) {
	for _, size := range []int{1, 10, 100, 1000, 10000, 100000, 1000000} {
		benchmarkAccessStructure(b, size)
	}
}

func benchmarkAccessStructure(b *testing.B, size int) {
	var indexes = make([]int, size, size)
	var arr = make([]int, size, size)
	var hash = make(map[int]int)

	rand.Seed(size % 42)
	for i := 0; i < size; i++ {
		indexes[i] = rand.Intn(size)
		arr[i] = i
		hash[i] = i
	}

	b.ResetTimer()

	b.Run(fmt.Sprintf("Array_%d", size), func(b *testing.B) {
		for i := 0; i < b.N; i++ {
			indx := indexes[i%size] % size
			_ = arr[indx]
		}
	})

	b.Run(fmt.Sprintf("Hash_%d", size), func(b *testing.B) {
		for i := 0; i < b.N; i++ {
			indx := indexes[i%size] % size
			_ = hash[indx]
		}
	})
}
$ go test -bench=.
goos: darwin
goarch: amd64
pkg: github.com/miry/samples/benchmarks
BenchmarkAccessStructure/Array_1-4         	100000000	        25.2 ns/op
BenchmarkAccessStructure/Hash_1-4          	50000000	        35.5 ns/op
BenchmarkAccessStructure/Array_10-4        	50000000	        25.5 ns/op
BenchmarkAccessStructure/Hash_10-4         	30000000	        42.8 ns/op
BenchmarkAccessStructure/Array_100-4       	100000000	        25.2 ns/op
BenchmarkAccessStructure/Hash_100-4        	30000000	        43.6 ns/op
BenchmarkAccessStructure/Array_1000-4      	50000000	        25.5 ns/op
BenchmarkAccessStructure/Hash_1000-4       	20000000	        63.6 ns/op
BenchmarkAccessStructure/Array_10000-4     	100000000	        25.3 ns/op
BenchmarkAccessStructure/Hash_10000-4      	20000000	        73.1 ns/op
BenchmarkAccessStructure/Array_100000-4    	50000000	        25.4 ns/op
BenchmarkAccessStructure/Hash_100000-4     	20000000	        95.6 ns/op
BenchmarkAccessStructure/Array_1000000-4   	50000000	        25.3 ns/op
BenchmarkAccessStructure/Hash_1000000-4    	10000000	       169 ns/op
PASS
ok  	github.com/miry/samples/benchmarks	24.523s
To generate a chart, we need to install the client and run this script:
$ go test -bench=. | benchgraph
It would return a link to the chart, here is the example: http://benchgraph.codingberg.com/48.
This chart could be embedded to your page with a code snippet that available on the page. It uses Google Charts in the background. You can read sources of the page and build your own online solution.

Michael Nikitochkin is a Lead Software Engineer. Follow him on LinkedIn or GitHub.
If you enjoyed this story, we recommend reading our latest tech stories and trending tech stories.