How to begin with Traces in Crystal
TL;DR: Primitve two code examples to start working with Traces
Kirk Haines³ recently started working on making opentelemetry available for Crystal applications¹. I collected the primitive examples that help understand distributed traces.
First spans to stdout
OpenTelemetry supports a different kinds of exporters (in order to visualize and analyze your traces and metrics, you will need to export them to a backend). The basic and default one is to print traces directly to STDOUT. I find it very useful — exporter prints all details of collected information.
# stdout_exporter_sample.cr
require "opentelemetry-api"
STDOUT.sync = true
OpenTelemetry.configure do |config|
  config.service_name = "stdout_exporter_sample"
  config.service_version = "0.1.0"
  config.sampler = OpenTelemetry::Sampler::AlwaysOn.new
  config.exporter = OpenTelemetry::Exporter.new(variant: :stdout)
end
tracer = OpenTelemetry.tracer_provider.tracer
tracer.in_span("first_operation") do |root_span|
  root_span.consumer!
  root_span.set_attribute("foo", "BAR")
  root_span.set_attribute("url", "http://example.com/foo")
root_span.add_event("dispatching logs")
  tracer.in_span("inner_operation") do |child_span|
    child_span.add_event("handling request")
    tracer.in_span("get_user_from_db") do |child_span|
      child_span.producer!
      child_span.add_event("querying database")
    end
  end
  tracer.in_span("process_second_stage") do |child_span|
    child_span.add_event("checked permissions")
    tracer.in_span("write_to_storage") do |child_span|
      child_span.producer!
      child_span.add_event("insert user")
    end
  end
end
# Make sure all exporter stdout finish in exporter fiber
sleep(1)
Execute the script and check output
$ crystal run stdout_exporter_sample.cr
{
 “type”:”trace”,
 “traceId”:”1479beb8000eda2fcff1fe91c777feb6",
…
First spans via OTLP
Of course, STDOUT is good only in local or test environments. The common protocol for OpenTelemetry is OTLP. For testing purposes I use Jaeger², but you can pick any other solutions: local or remote services. Jaeger² supports the OTLP protocol (besides its own solution). It simplifies our local environment to run trace collector and UI in a single process. Run Jaeger in the background with docker:
$ docker run -d — name jaeger \
 -e COLLECTOR_OTLP_ENABLED=true \
 -p 16686:16686 \
 -p 4317:4317 \
 -p 4318:4318 \
 jaegertracing/all-in-one:1.35
You can access UI with http://localhost:16686 . Modify the previous example a bit:
# otlp_http_exporter_sample.cr
require "opentelemetry-api"
# Another way to configure OTLP exporter in case different hostname
ENV["OTEL_EXPORTER_OTLP_ENDPOINT"] ||= "http://localhost:4318/v1/traces"
OpenTelemetry.configure do |config|
  config.service_name = "otlp_http_sample"
  config.service_version = "0.1.1"
  config.sampler = OpenTelemetry::Sampler::AlwaysOn.new
  config.exporter = OpenTelemetry::Exporter.new(variant: "http") do |c|
    # NOTICE: It allows to flush spans faster and not to wait for 100 spans or 5 seconds
    cc = c.as(OpenTelemetry::Exporter::Http)
    cc.batch_threshold = 5
    cc.batch_latency = 1
  end
end
tracer = OpenTelemetry.tracer_provider.tracer
puts "Check trace: http://localhost:16686/trace/#{tracer.trace_id.hexstring}"
tracer.in_span("first_operation") do |root_span|
  root_span.consumer!
  root_span.set_attribute("foo", "BAR")
  root_span.set_attribute("url", "http://example.com/foo")
root_span.add_event("dispatching logs")
  tracer.in_span("inner_operation") do |child_span|
    child_span.add_event("handling request")
    tracer.in_span("get_user_from_db") do |child_span|
      child_span.producer!
      child_span.add_event("querying database")
    end
  end
  tracer.in_span("process_second_stage") do |child_span|
    child_span.add_event("checked permissions")
    tracer.in_span("write_to_storage") do |child_span|
      child_span.producer!
      child_span.add_event("insert user")
    end
  end
end
sleep(2)
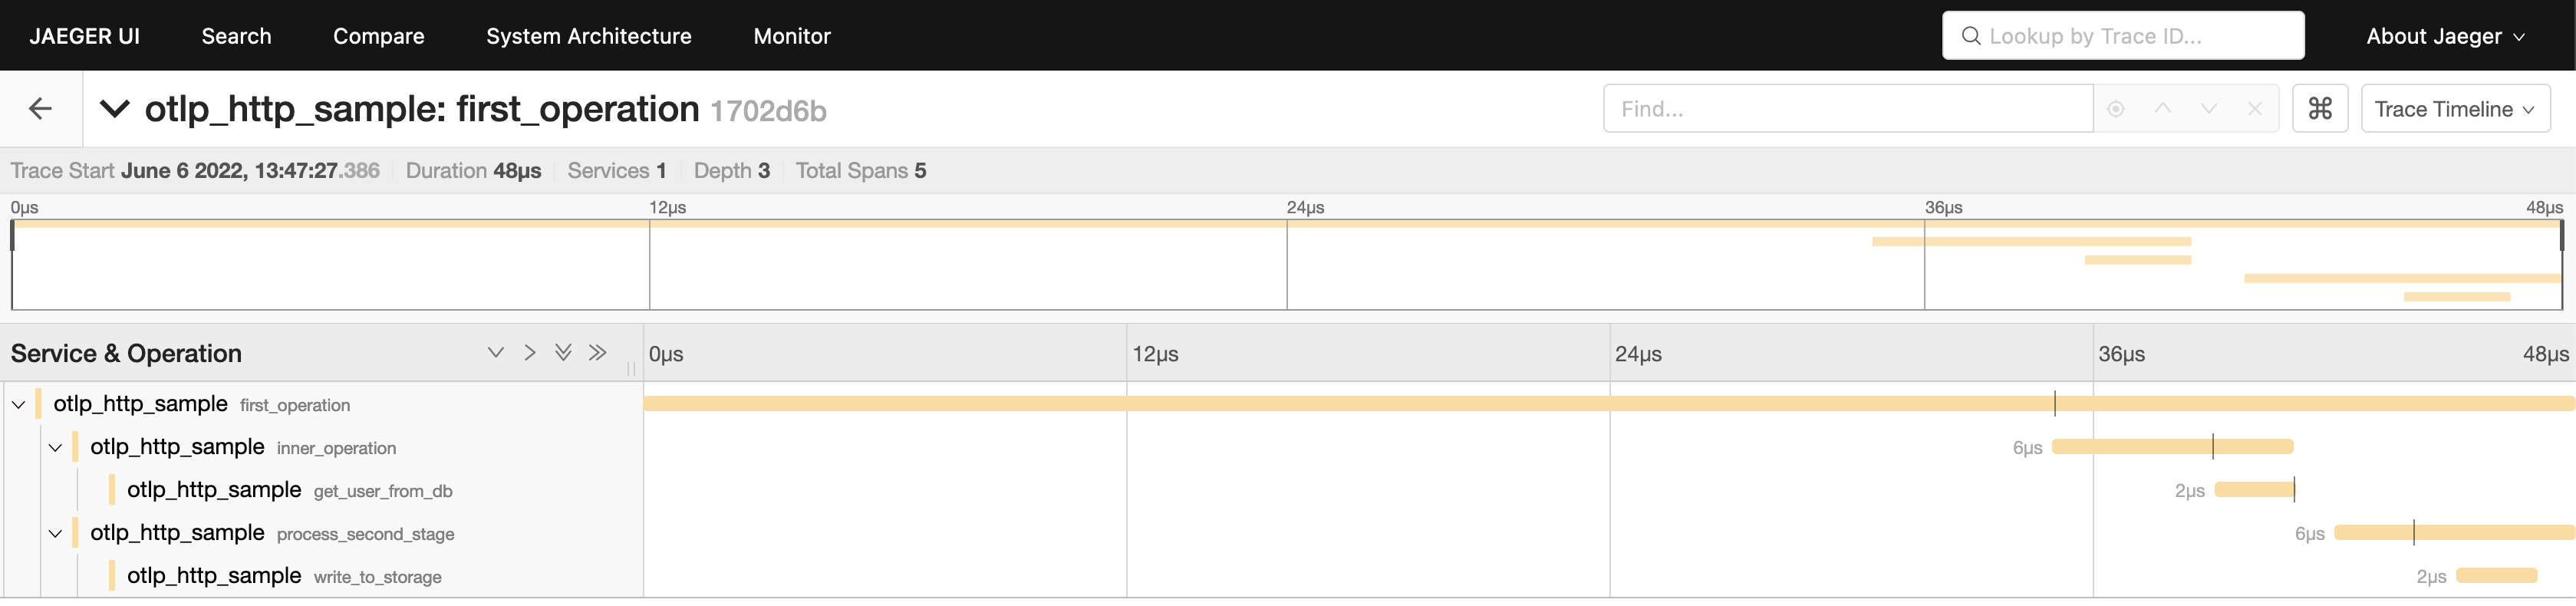
Open Jaeger’s Web UI on http://localhost:16686/ and check traces. The single trace view would looks like:

Michael Nikitochkin is a Lead Software Engineer. Follow him on LinkedIn or GitHub.
If you enjoyed this story, we recommend reading our latest tech stories and trending tech stories.
References
https://github.com/wyhaines/opentelemetry-api.cr/
https://www.jaegertracing.io/
https://github.com/wyhaines